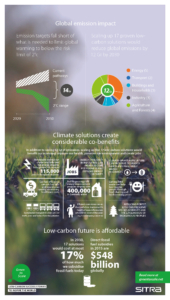
Here you will find the main infographics, they include:
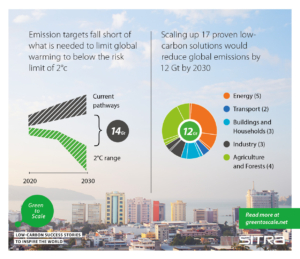
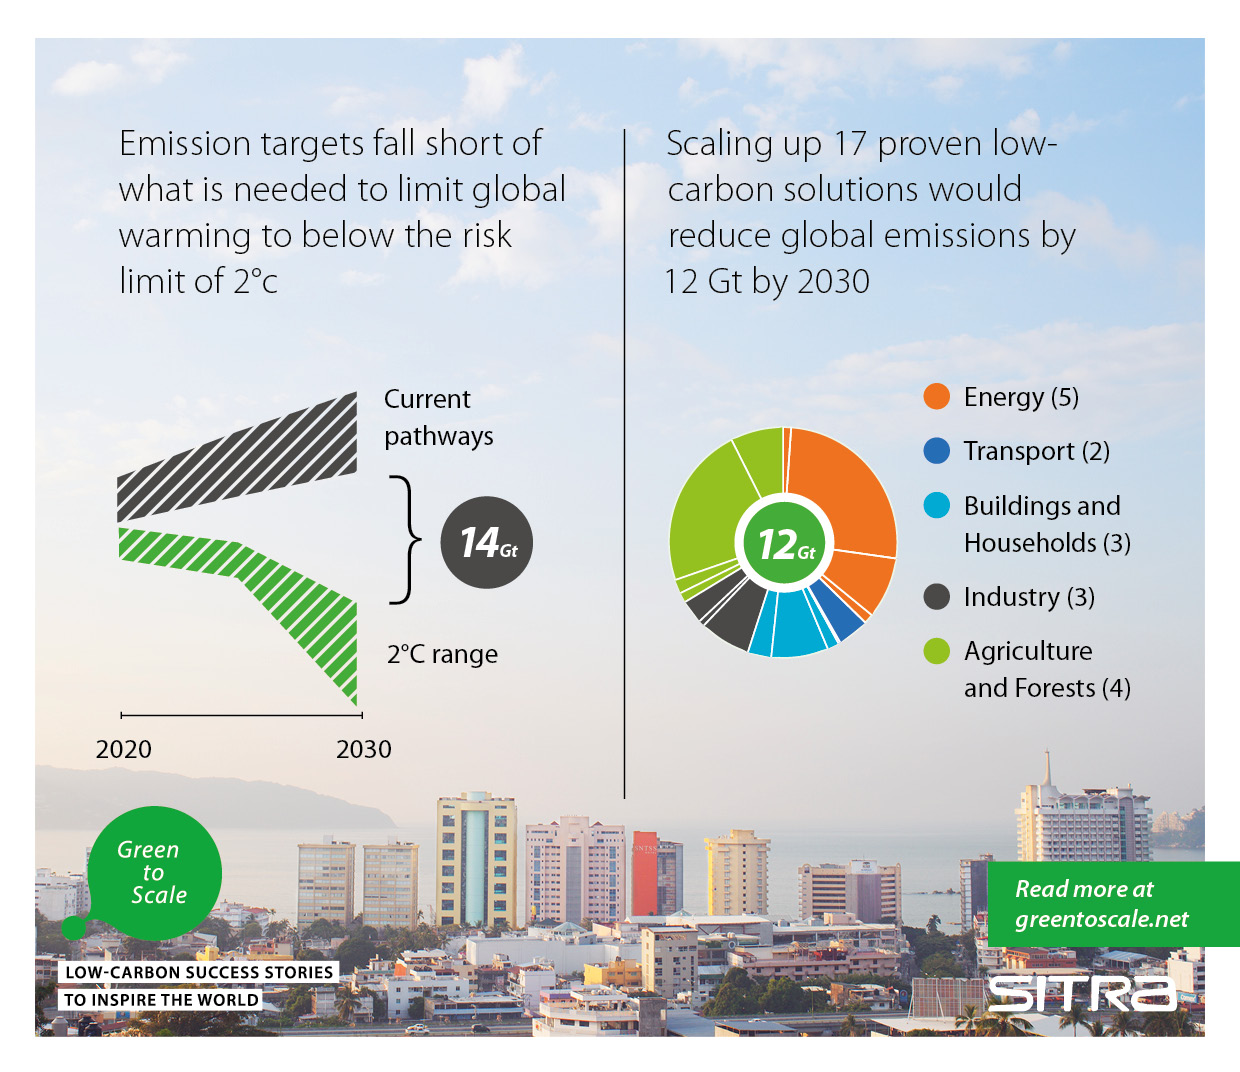
- Estimated emission impacts
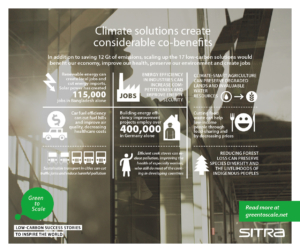
- Co-benefits
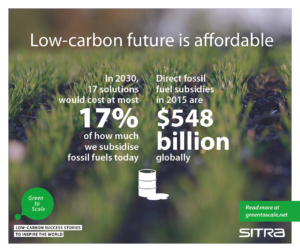
- Costs
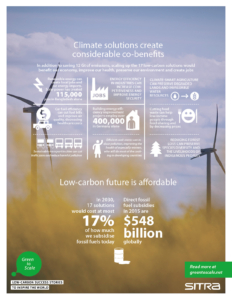
- Co-benefits and costs combined
- All infographs combined
This is your reading list. You can add items to the reading list by pressing ![]() in content lists or on the content page.
in content lists or on the content page.
No entries
This list shows the content that you have not finished reading. The list shows the last five content you have started reading.
No entries
Here you will find the main infographics, they include:


Recommended
Have some more.