
On 16 January Sitra released its third study on the carbon footprint of companies listed on the Helsinki Stock Exchange. A morning seminar was full of people from the financial sector and the event was also widely reported in the media.
We calculated the carbon footprint of Sitra’s own Finnish-listed stock investments ourselves for a third time using the same calculator and assessment criteria we make available to others, and which we have also used for calculating the figures published in our annual report. Sitra’s carbon footprint has declined considerably from 2016.
An impressive 47% decline
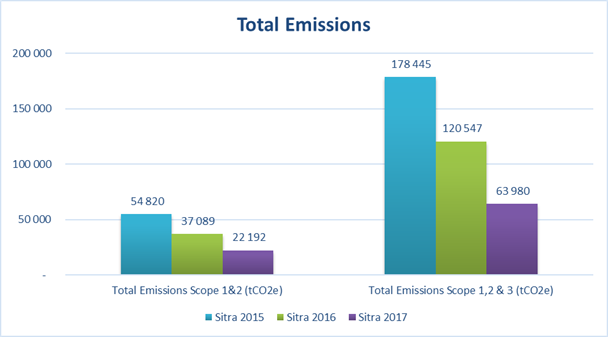
The total emissions of Sitra’s Finnish shareholdings have declined by an impressive 47% from last year – down from 120 000 tonnes of carbon dioxide (CO2e) to 64 000 tonnes. The significance of the decline is underscored by the fact that the combined absolute total emissions of companies listed on the Helsinki Stock Exchange went down by just six per cent in the same period. In addition, the market value of Sitra’s Finnish shareholdings grew at the same time by 16% a year, from 155 million euros to 178 million euros (30 September 2017).
When comparing the carbon footprint, efforts are made to make information on emissions more easily comparable by calculating various key figures. Sitra’s Finnish investments improved their footprint for a second year running, according to all indicators.
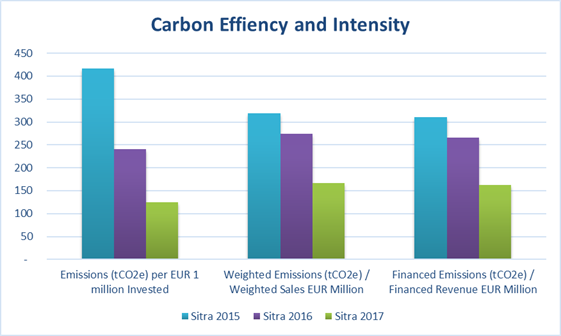
The carbon efficiency of Sitra’s investments improved by 48 per cent on the previous year’s level. The carbon efficiency of companies listed on the Helsinki Stock Exchange improved by just 16 per cent. Carbon efficiency indicates the amount of carbon dioxide emissions for every million euros invested. This enables the comparison of investments of different sizes. The weakness of this indicator is its sensitivity to the rise in share value.
Carbon intensity, meanwhile, describes greenhouse gas emissions in relation to turnover. There are two different versions of this indicator. Weighted Emissions (tCO2e)/Weighted Sales EUR Million calculate the result exclusively from the point of view of the shareholder. Financed Emissions (tCO2e)/Financed Revenue EUR Million also take into account the amount of funding that the company receives conditional to external capital. The advantage of this is that the result does not fluctuate with share prices. However, even this indicator is not perfect. For instance, with oil companies, the figure is significantly affected by the price of oil.
Under both indicator versions, the carbon intensity of Sitra’s investment improved by 39 per cent. The carbon intensity of companies listed on the Helsinki Stock Exchange improved from zero to nine per cent under various indicators.
Accountability is also important in investment activities and we discuss the carbon risk with fund investors as part of normal evaluation processes. Our goal is to ensure that our asset managers take matters of accountability into consideration when making decisions on investments. However, Sitra has not set any targets for the carbon footprint of its investments. The carbon footprint is a good measure for determining climate risks and for comparing companies operating in the same field, but it does not reveal the whole picture on the relative superiority of companies operating in different fields when it comes to the reduction of greenhouse gas emissions.
More information on the topic is available in the published report or in the recording of the seminar.


Recommended
Have some more.